Overview
Thar Ki Co · Contract · 2026
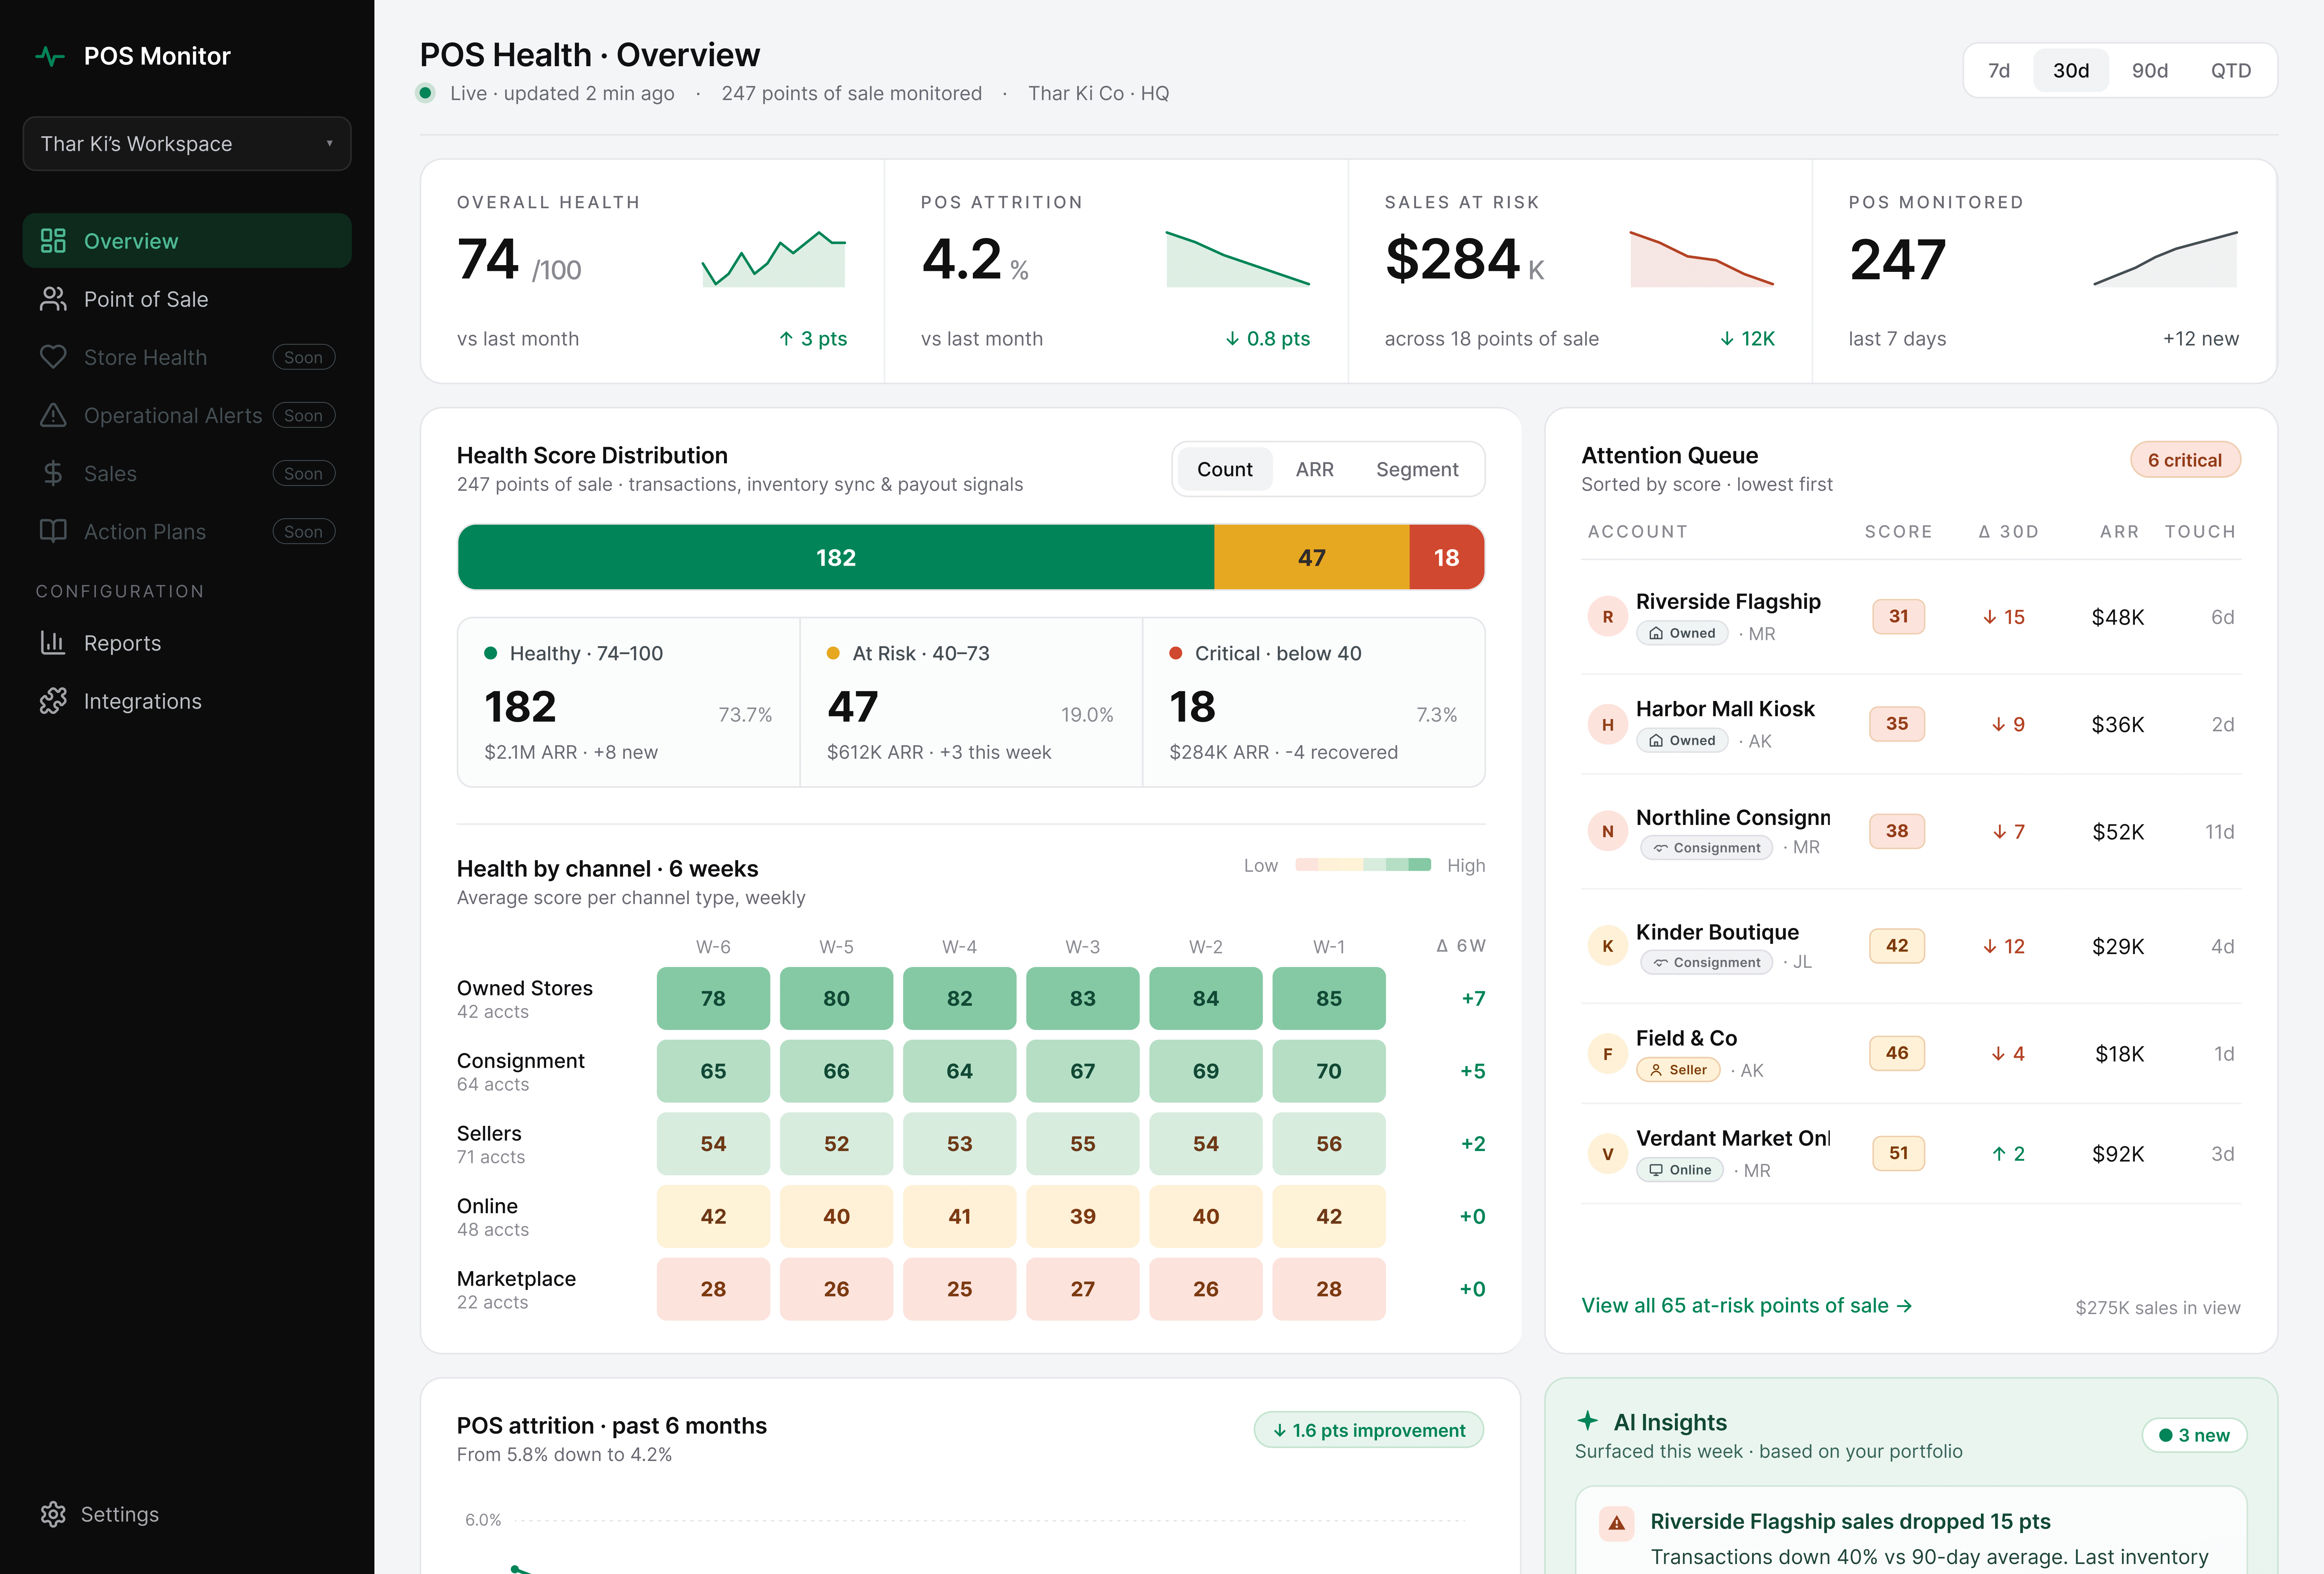
Thar Ki Co operates 247 points of sale across Thailand and Myanmar, spanning owned stores, consignment partners, and online channels. The client briefed it as a churn dashboard redesign. The first call clarified the users were head-office ops staff tracking sales performance, not a customer success team tracking accounts.
Impact
Challenge
The brief described a churn dashboard. The product wasn’t one.
The client came in asking for a redesign of a “churn dashboard” they’d built internally. The first call clarified something different: the users were head-office retail operations staff monitoring 247 points of sale across different channels.
The existing product was built on customer-success conventions. The users needed retail operations language. The onboarding and overview were reframed around retail before design started.
Who uses it
Head-office retail operations staff, on desktop, alongside email and spreadsheets.
They open it in the morning to see which stores and channels need attention, and again after exec meetings to check numbers.
What was wrong with the starting point
The product was landing users on a data-heavy dashboard without data. It felt incomplete, not powerful. The redesign needed to make onboarding its own experience, not a banner on top of an empty overview.
Empty states that teach users to expect nothing
A new user lands on six empty panels, each saying “No data yet.” None explain what filling them will unlock. A screen that reads as “nothing is here” teaches the user to expect the same tomorrow.
Setup buried in noise
The first-time user has one job: connect their POS system. But that job shows up as one option among eight, competing with churn cards, revenue panels, and an empty AI sidebar. Setup gets lost in the crowd.
Ambiguity at the first decision
Four buttons compete on the same screen. Ambiguity at step one isn’t fatal for a required internal tool the way it would be for a SaaS evaluator, but it adds friction to every onboarding.
One screen was doing two jobs.
I split them.
Onboarding became a three-step flow with a clear end.
The overview became a dashboard built for people who already know their business.
Solution
Onboarding built from scratch
The existing product didn’t have an onboarding flow. Setup prompts were layered on top of an empty dashboard. The redesign broke setup into three steps, each doing one thing.
Step 1 — Connect
Named integrations and a visible time estimate reduce the anxiety of starting.
Step 2 — Import
Live progress with specific counts (“24 stores detected”) shows the system is reading the business, not spinning.
Step 3 — Configure
Different employees watch different data, so the Configure step lets users shape what they track from day one, with everything adjustable later in Settings.
The onboarding language and feature cards are written for someone learning the tool from scratch, not just head-office staff who already know it. The team plans to expand the tool beyond head office to consignment partners and other groups, so the onboarding teaches the product without assuming familiarity. It shipped for current users without needing rework when new ones arrive.
The Overview, rebuilt around how the business gets read

Four metrics at the top, mirroring the old labels
The old product surfaced Portfolio Health Score, Churn Rate, Revenue at Risk, At Risk Accounts. The new set preserves that shape (Overall Health, POS Attrition, Sales at Risk, POS Monitored) so existing users keep their muscle memory while the language shifts to retail.

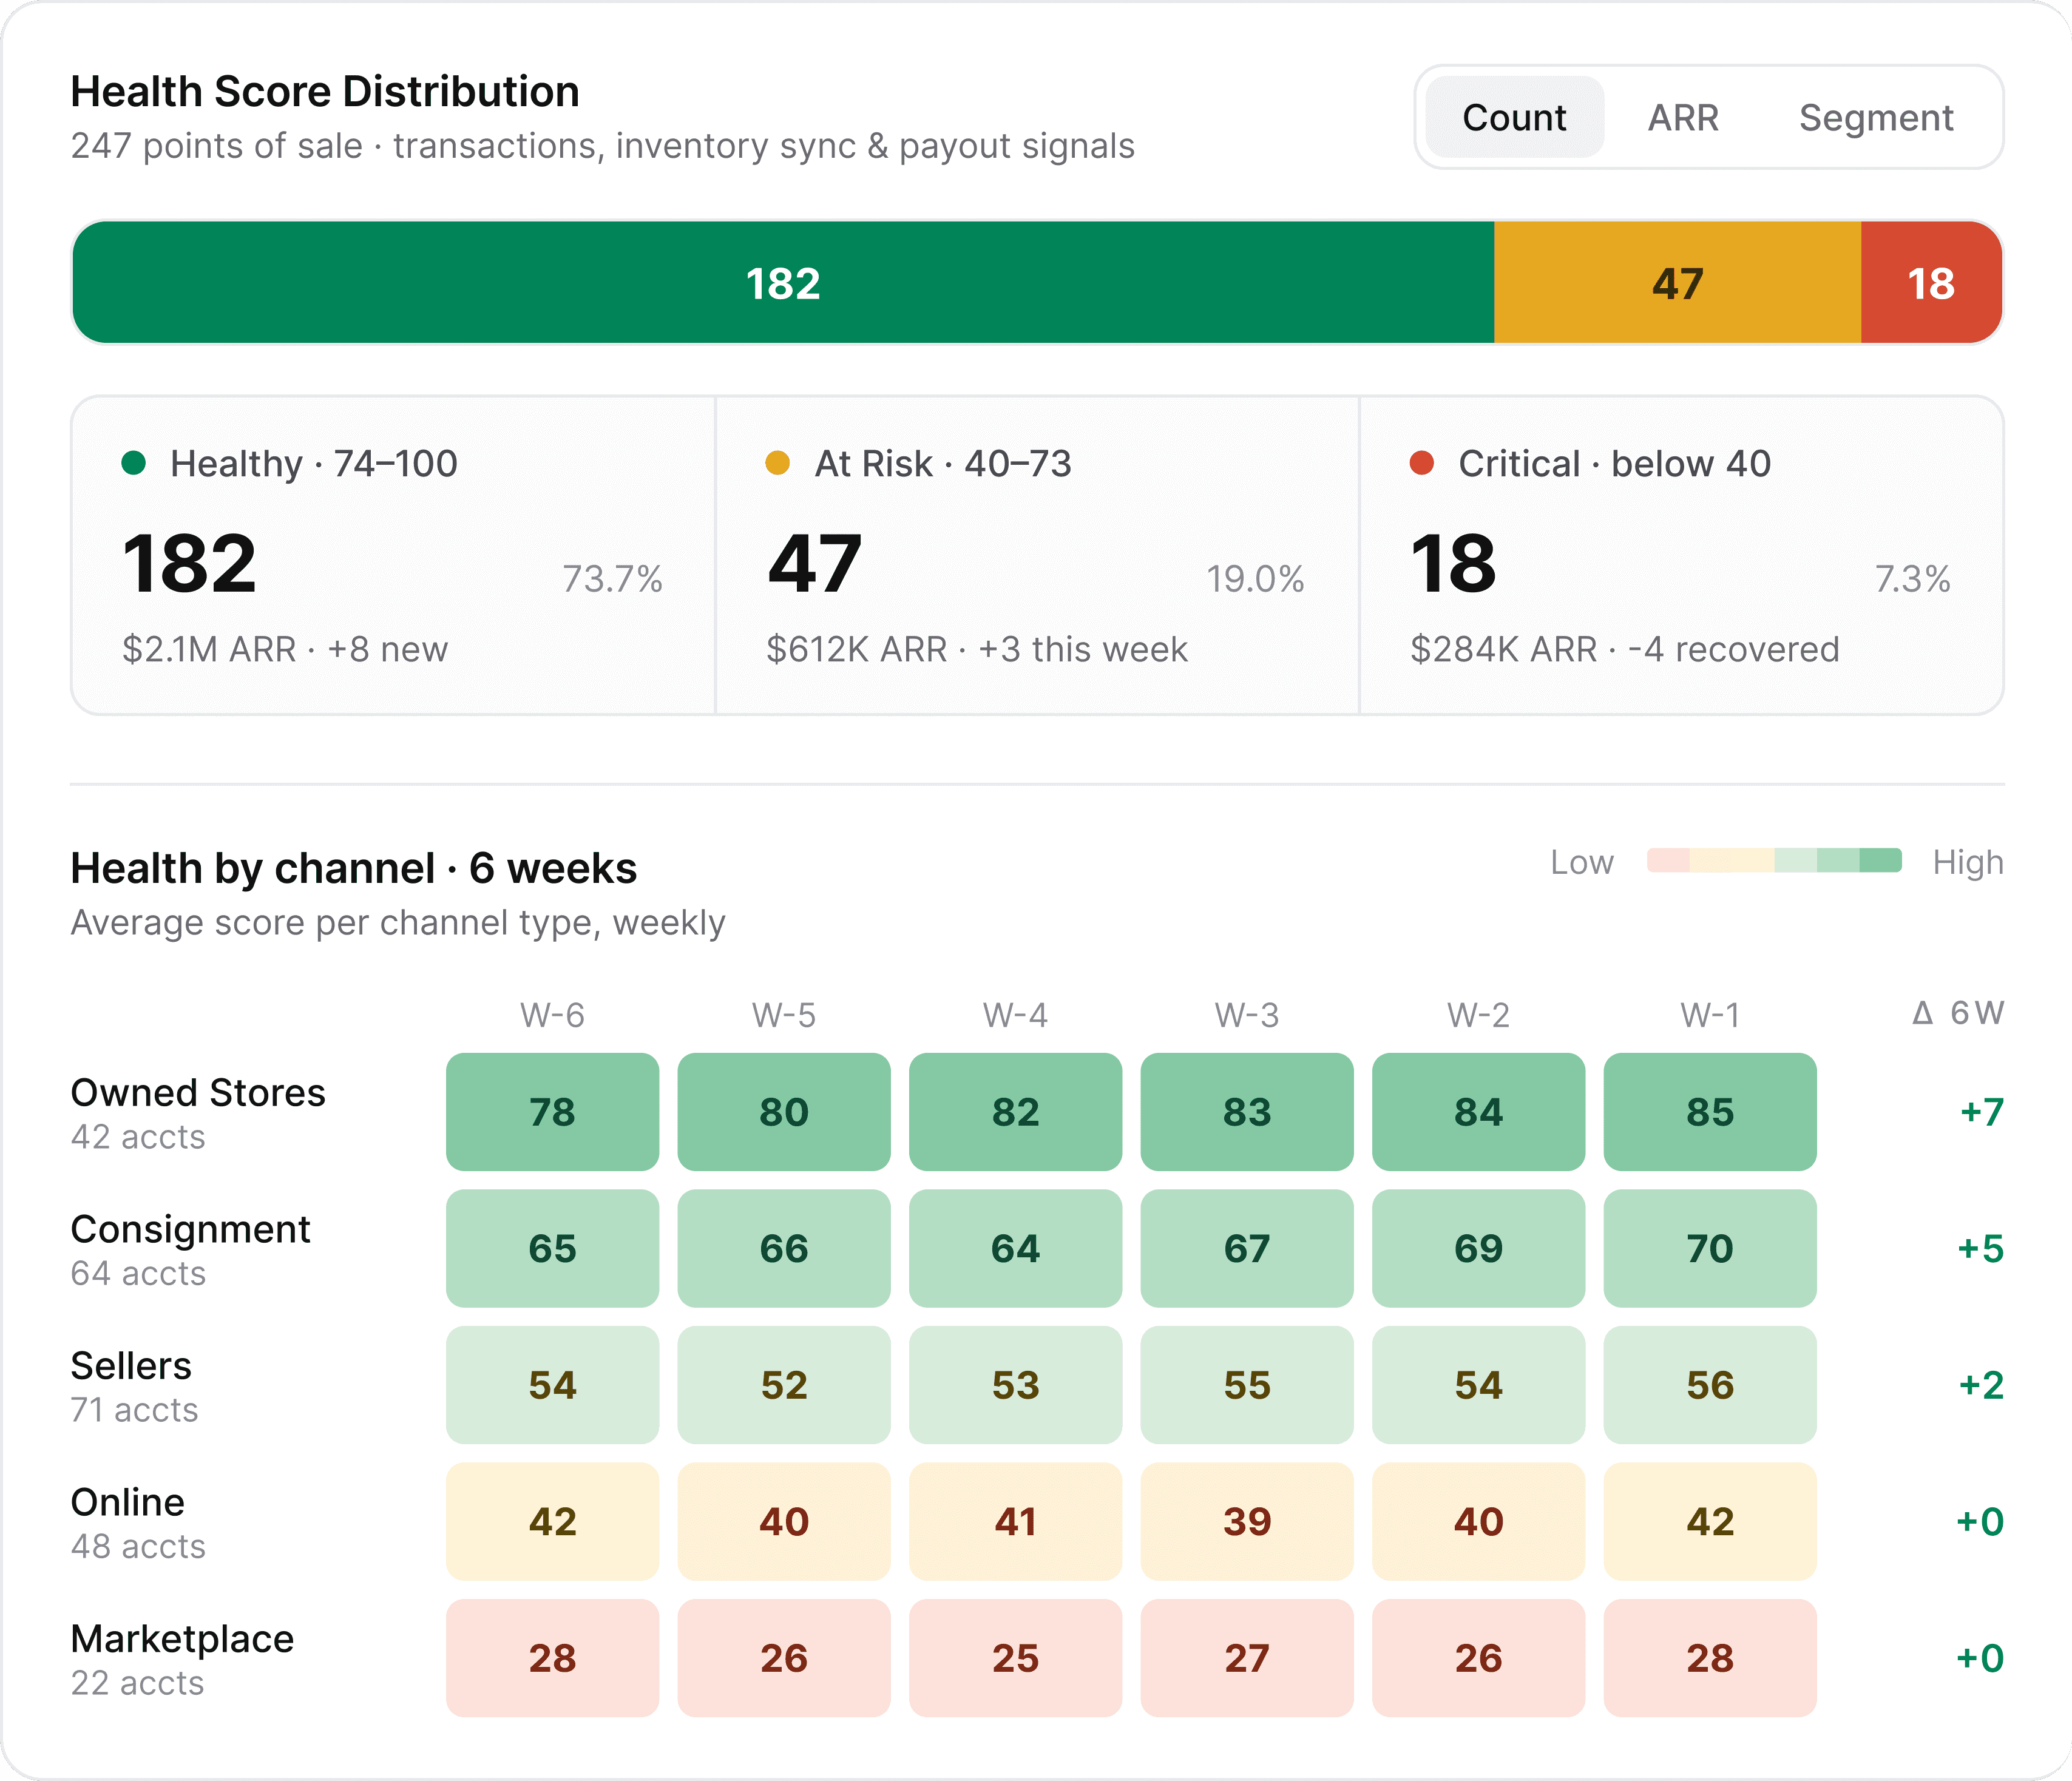
A channel heatmap that compares performance across store types over six weeks
The business runs across five channel types (Owned, Consignment, Sellers, Online, Marketplace) and the morning question is usually “which channel is trending which way?” A grid with six weeks per channel answers that in one look, with a 6-week delta column confirming direction. Three separate line charts would have needed three glances. The heatmap needs one.
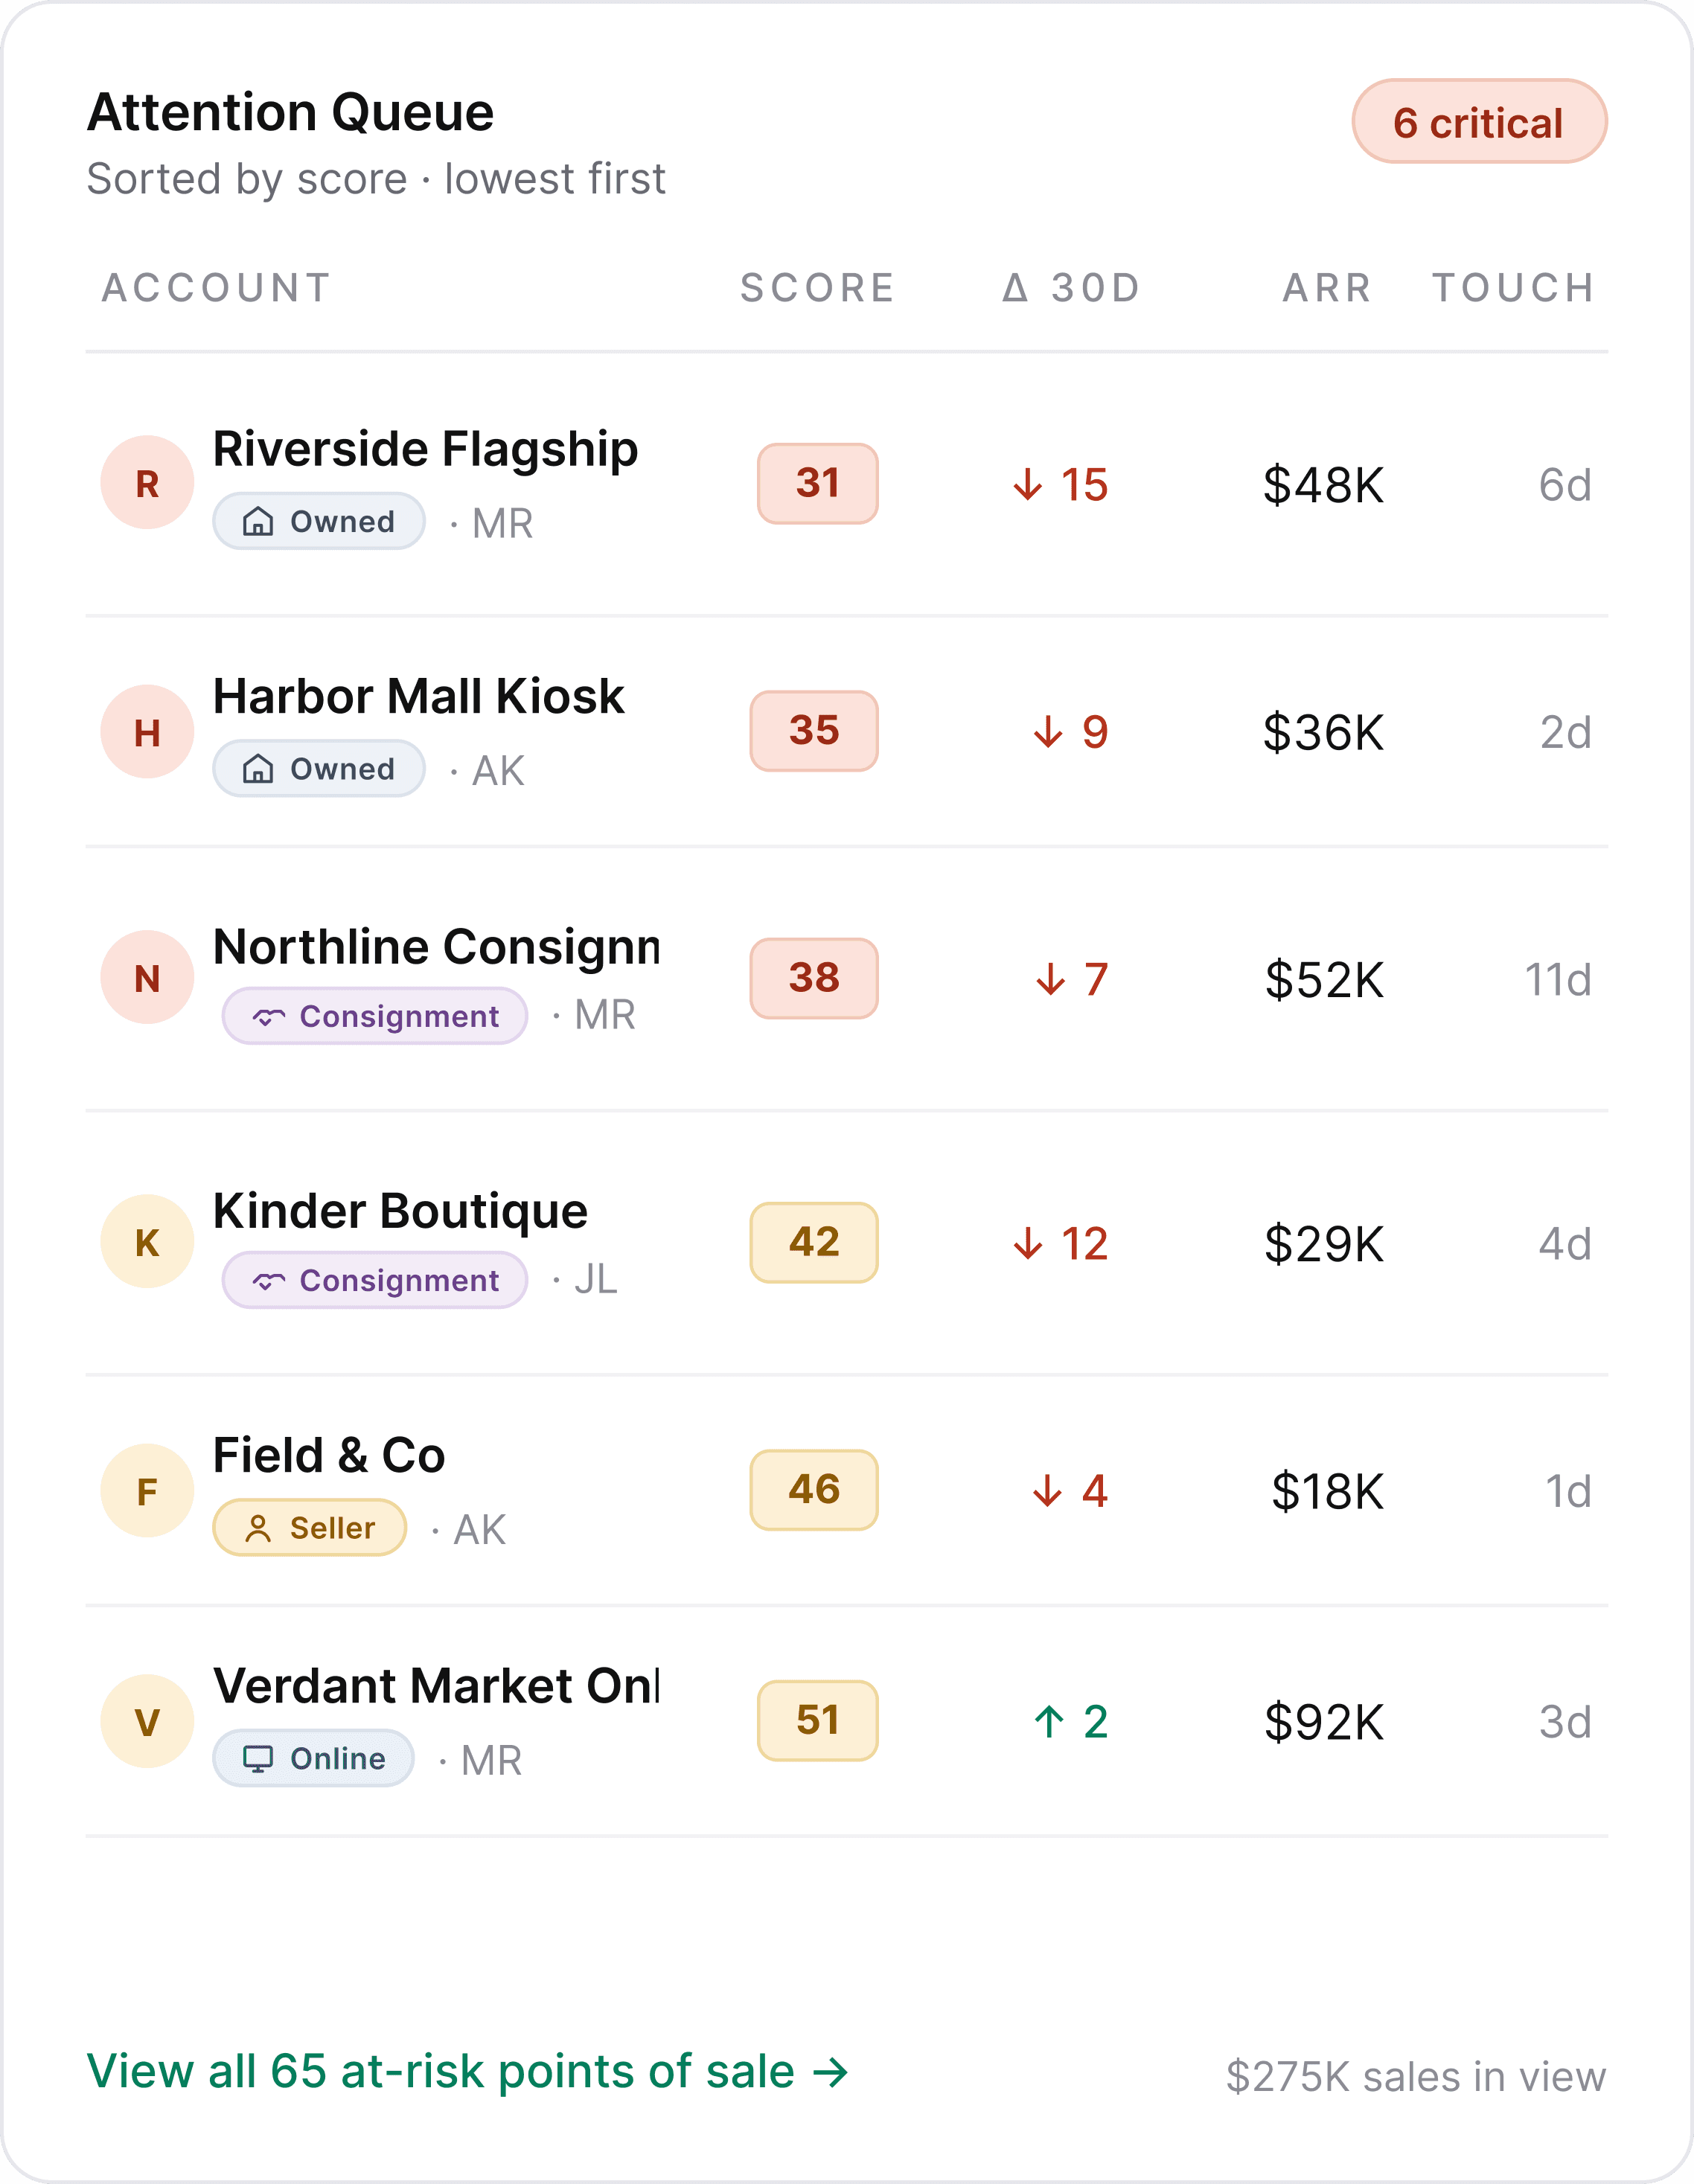
An Attention Queue sorted by lowest score first
The first thing a head-office lead needs to know is which specific stores are in trouble right now. Lowest scores sit at the top. Each row names the store, channel type, score, 30-day delta, and ARR, so triage happens in the time it takes to scan five rows.
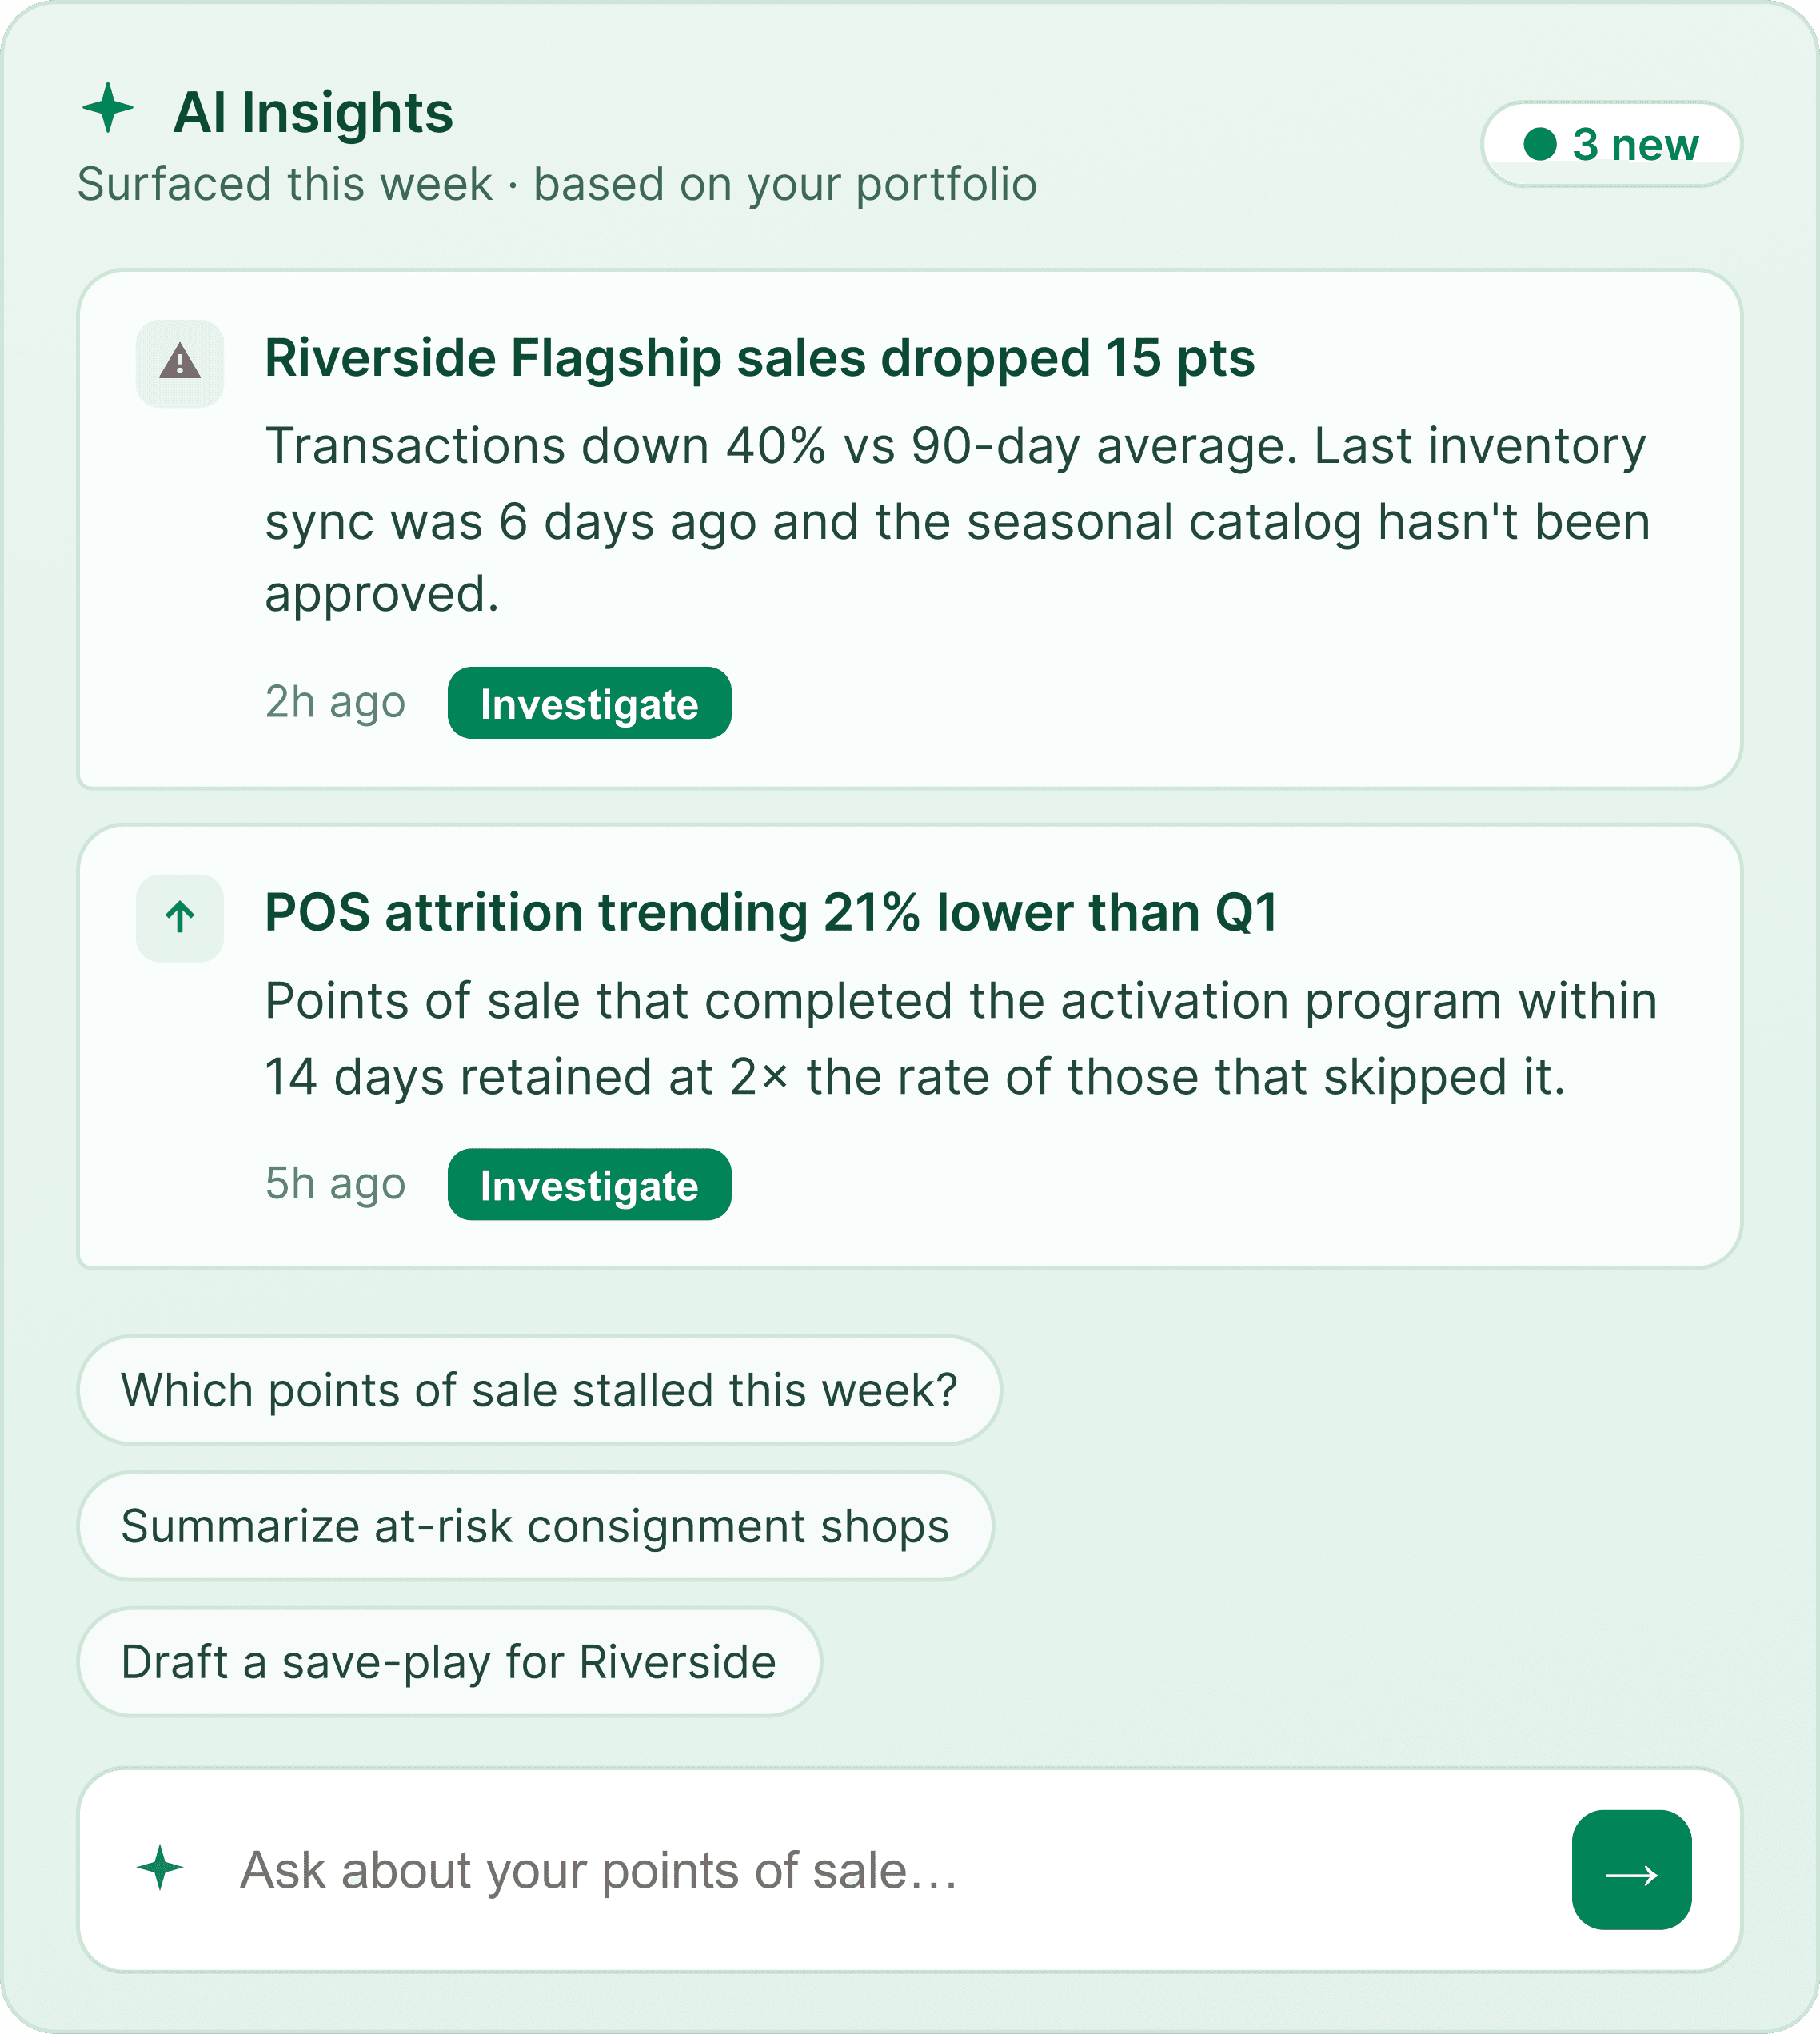
An AI Insights panel structured around specific findings, not a blank chat
The client wanted an AI chat. I proposed a structured panel instead: surfaced insights with specific stores and numbers, starter prompts for common questions, and free-text input for anything else. A blank chat asks users to know what to ask. This shows them what’s worth asking first.
One thing grew during review
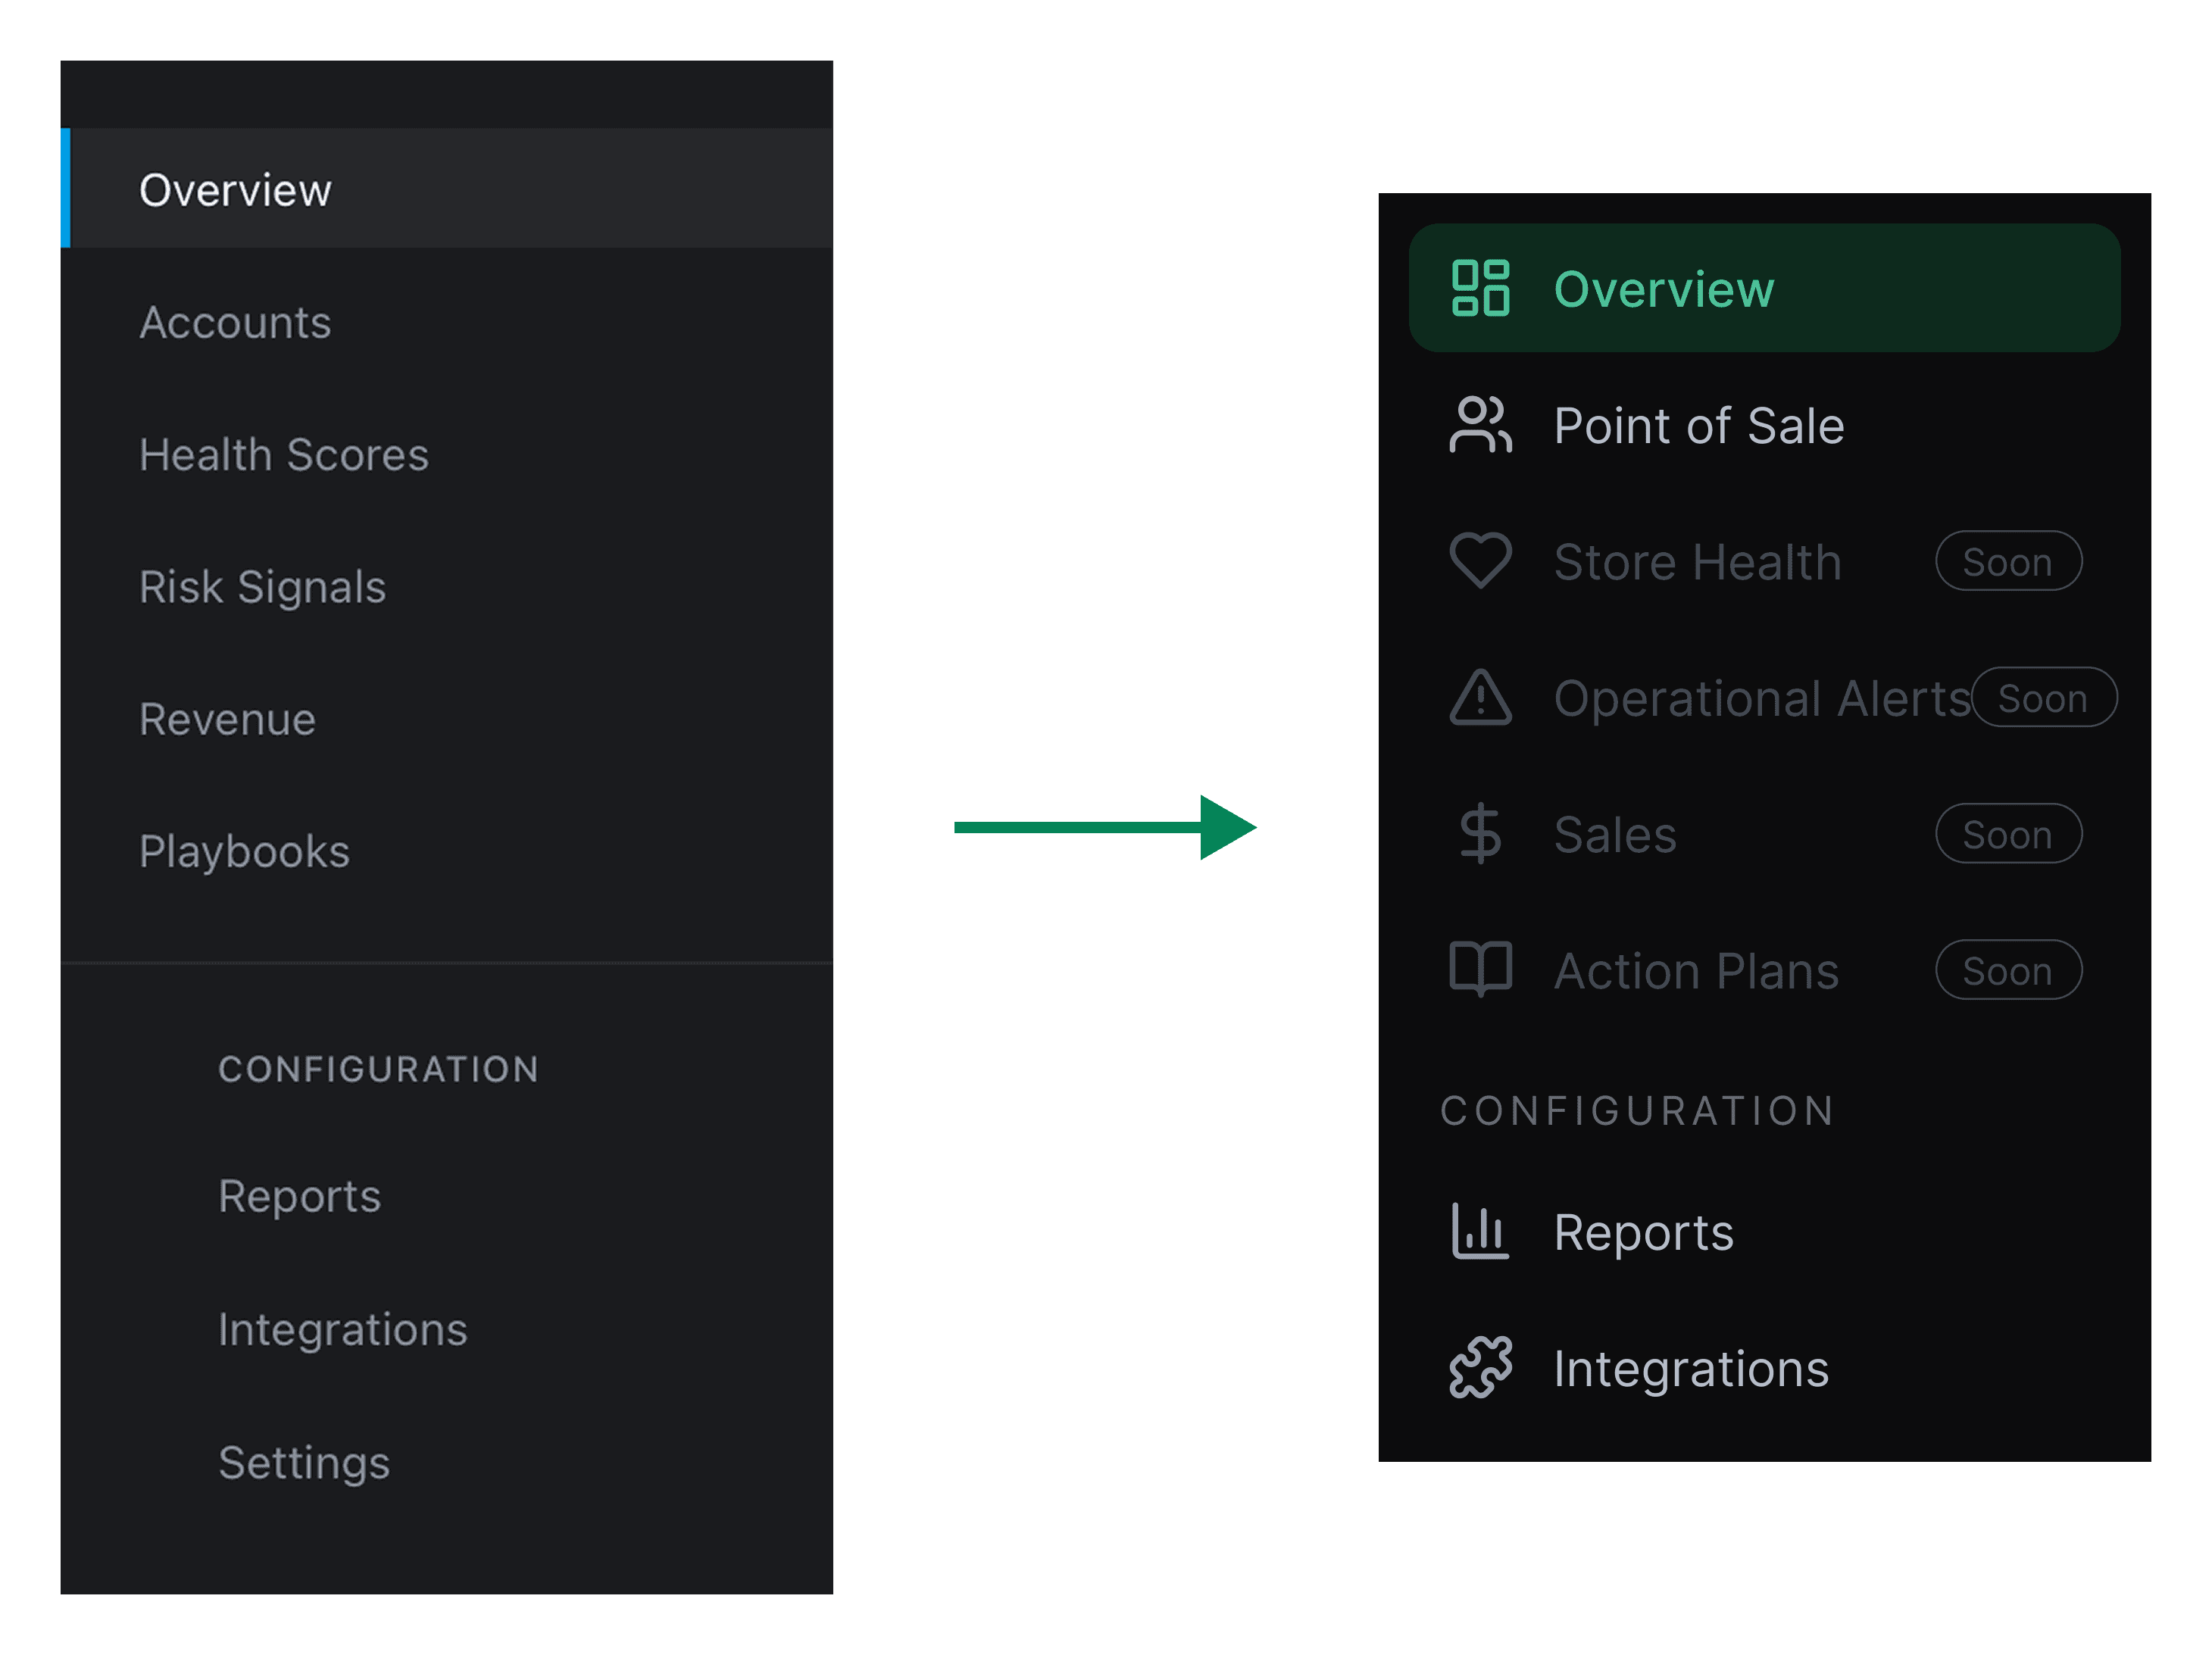
A review round added one change: sidebar labels renamed to match the retail framing. The underlying pages stayed out of scope, shown as “Soon.” A small change, but it set the direction for the rest of the product.
Outcome
The client is building out the remaining pages against the new sidebar framing. Future phases were discussed but not scoped during this engagement.


