SignalBoard
SignalBoard
SignalBoard
For SaaS leadership teams who live across too many tools
For SaaS leadership teams who live across too many tools
For SaaS leadership teams who live across too many tools

The system replaces fragmented reporting with a structured view of business health.
The system replaces fragmented reporting with a structured view of business health.
The system replaces fragmented reporting with a structured view of business health.
Problem
Problem
Revenue lives in one tool, retention in another, acquisition in a third. By the time leadership has the full picture, the context has already shifted.
Revenue lives in one tool, retention in another, acquisition in a third. By the time leadership has the full picture, the context has already shifted.
Problem
Revenue lives in one tool, retention in another, acquisition in a third. By the time leadership has the full picture, the context has already shifted.
Approach
Approach
The dashboard is structured around the questions executives actually ask, not the data schema behind them. Every grouping decision was made to reduce the time between opening the product and understanding the business.
The dashboard is structured around the questions executives actually ask, not the data schema behind them. Every grouping decision was made to reduce the time between opening the product and understanding the business.
Approach
The dashboard is structured around the questions executives actually ask, not the data schema behind them. Every grouping decision was made to reduce the time between opening the product and understanding the business.
Design Goals
Design Goals
Decision Speed
Decision Speed
Decision Speed
Leadership gets the full picture the moment they open the dashboard. No waiting for a report, no piecing together data from separate tools.
Leadership gets the full picture the moment they open the dashboard. No waiting for a report, no piecing together data from separate tools.
Reduce Cognitive Load
Reduce Cognitive Load
Reduce Cognitive Load
Each view is scoped to one business question. Revenue, retention, and acquisition are separated so teams can focus without switching context.
Each view is scoped to one business question. Revenue, retention, and acquisition are separated so teams can focus without switching context.
Data That Speaks For Itself
Data That Speaks For Itself
Data That Speaks For Itself
Charts and metrics are structured so trends and risks are visible at a glance. No training required to read the dashboard.
Charts and metrics are structured so trends and risks are visible at a glance. No training required to read the dashboard.
Revenue Analytics
Revenue Analytics
Built for finance and leadership teams who need recurring revenue, expansion, and retention in one place. Metric switching lets them explore the data without losing their place.
Built for finance and leadership teams who need recurring revenue, expansion, and retention in one place. Metric switching lets them explore the data without losing their place.
Built for finance and leadership teams who need recurring revenue, expansion, and retention in one place. Metric switching lets them explore the data without losing their place.
Customers Analytics
Customers Analytics
Growth and churn sit side by side so teams can see the full customer picture without switching views. Segmentation data helps identify which customers drive long term value.
Growth and churn sit side by side so teams can see the full customer picture without switching views. Segmentation data helps identify which customers drive long term value.
Growth and churn sit side by side so teams can see the full customer picture without switching views. Segmentation data helps identify which customers drive long term value.
Retention & Cohort Analysis
Retention & Cohort Analysis
Cohort analysis gives teams a long-term view of retention behavior, not just a snapshot. At-risk accounts surface early so teams can act before churn becomes a loss.
Cohort analysis gives teams a long-term view of retention behavior, not just a snapshot. At-risk accounts surface early so teams can act before churn becomes a loss.
Cohort analysis gives teams a long-term view of retention behavior, not just a snapshot. At-risk accounts surface early so teams can act before churn becomes a loss.
Acquisition & Funnel Insights
Acquisition & Funnel Insights
CAC, conversion rate, and sales cycle length in one view so teams can see where growth is slowing and why. Funnel analysis makes bottlenecks visible without digging through separate reports.
Acquisition performance across channels, conversion rates, and CAC in one view.
Funnel analysis highlights growth bottlenecks and efficiency gaps.
Acquisition performance across channels, conversion rates, and CAC in one view.
Funnel analysis highlights growth bottlenecks and efficiency gaps.
Design Language
Design Language

Labels stay small and muted so the number dominates at a glance.
Labels stay small and muted so the number dominates at a glance.
Labels stay small and muted so the number dominates at a glance.
Opacity encodes retention percentage so drop-off patterns are visible without reading every cell.
Opacity encodes retention percentage so drop-off patterns are visible without reading every cell.
Opacity encodes retention percentage so drop-off patterns are visible without reading every cell.
Single hue with no legend. Color carries no categorical meaning here, only the number does.
Single hue with no legend. Color carries no categorical meaning here, only the number does.
Single hue with no legend. Color carries no categorical meaning here, only the number does.
A consistent visual system across every view so the product feels reliable and professional at every touchpoint.
A consistent visual system across every view so the product feels reliable and professional at every touchpoint.
A consistent visual system across every view so the product feels reliable and professional at every touchpoint.
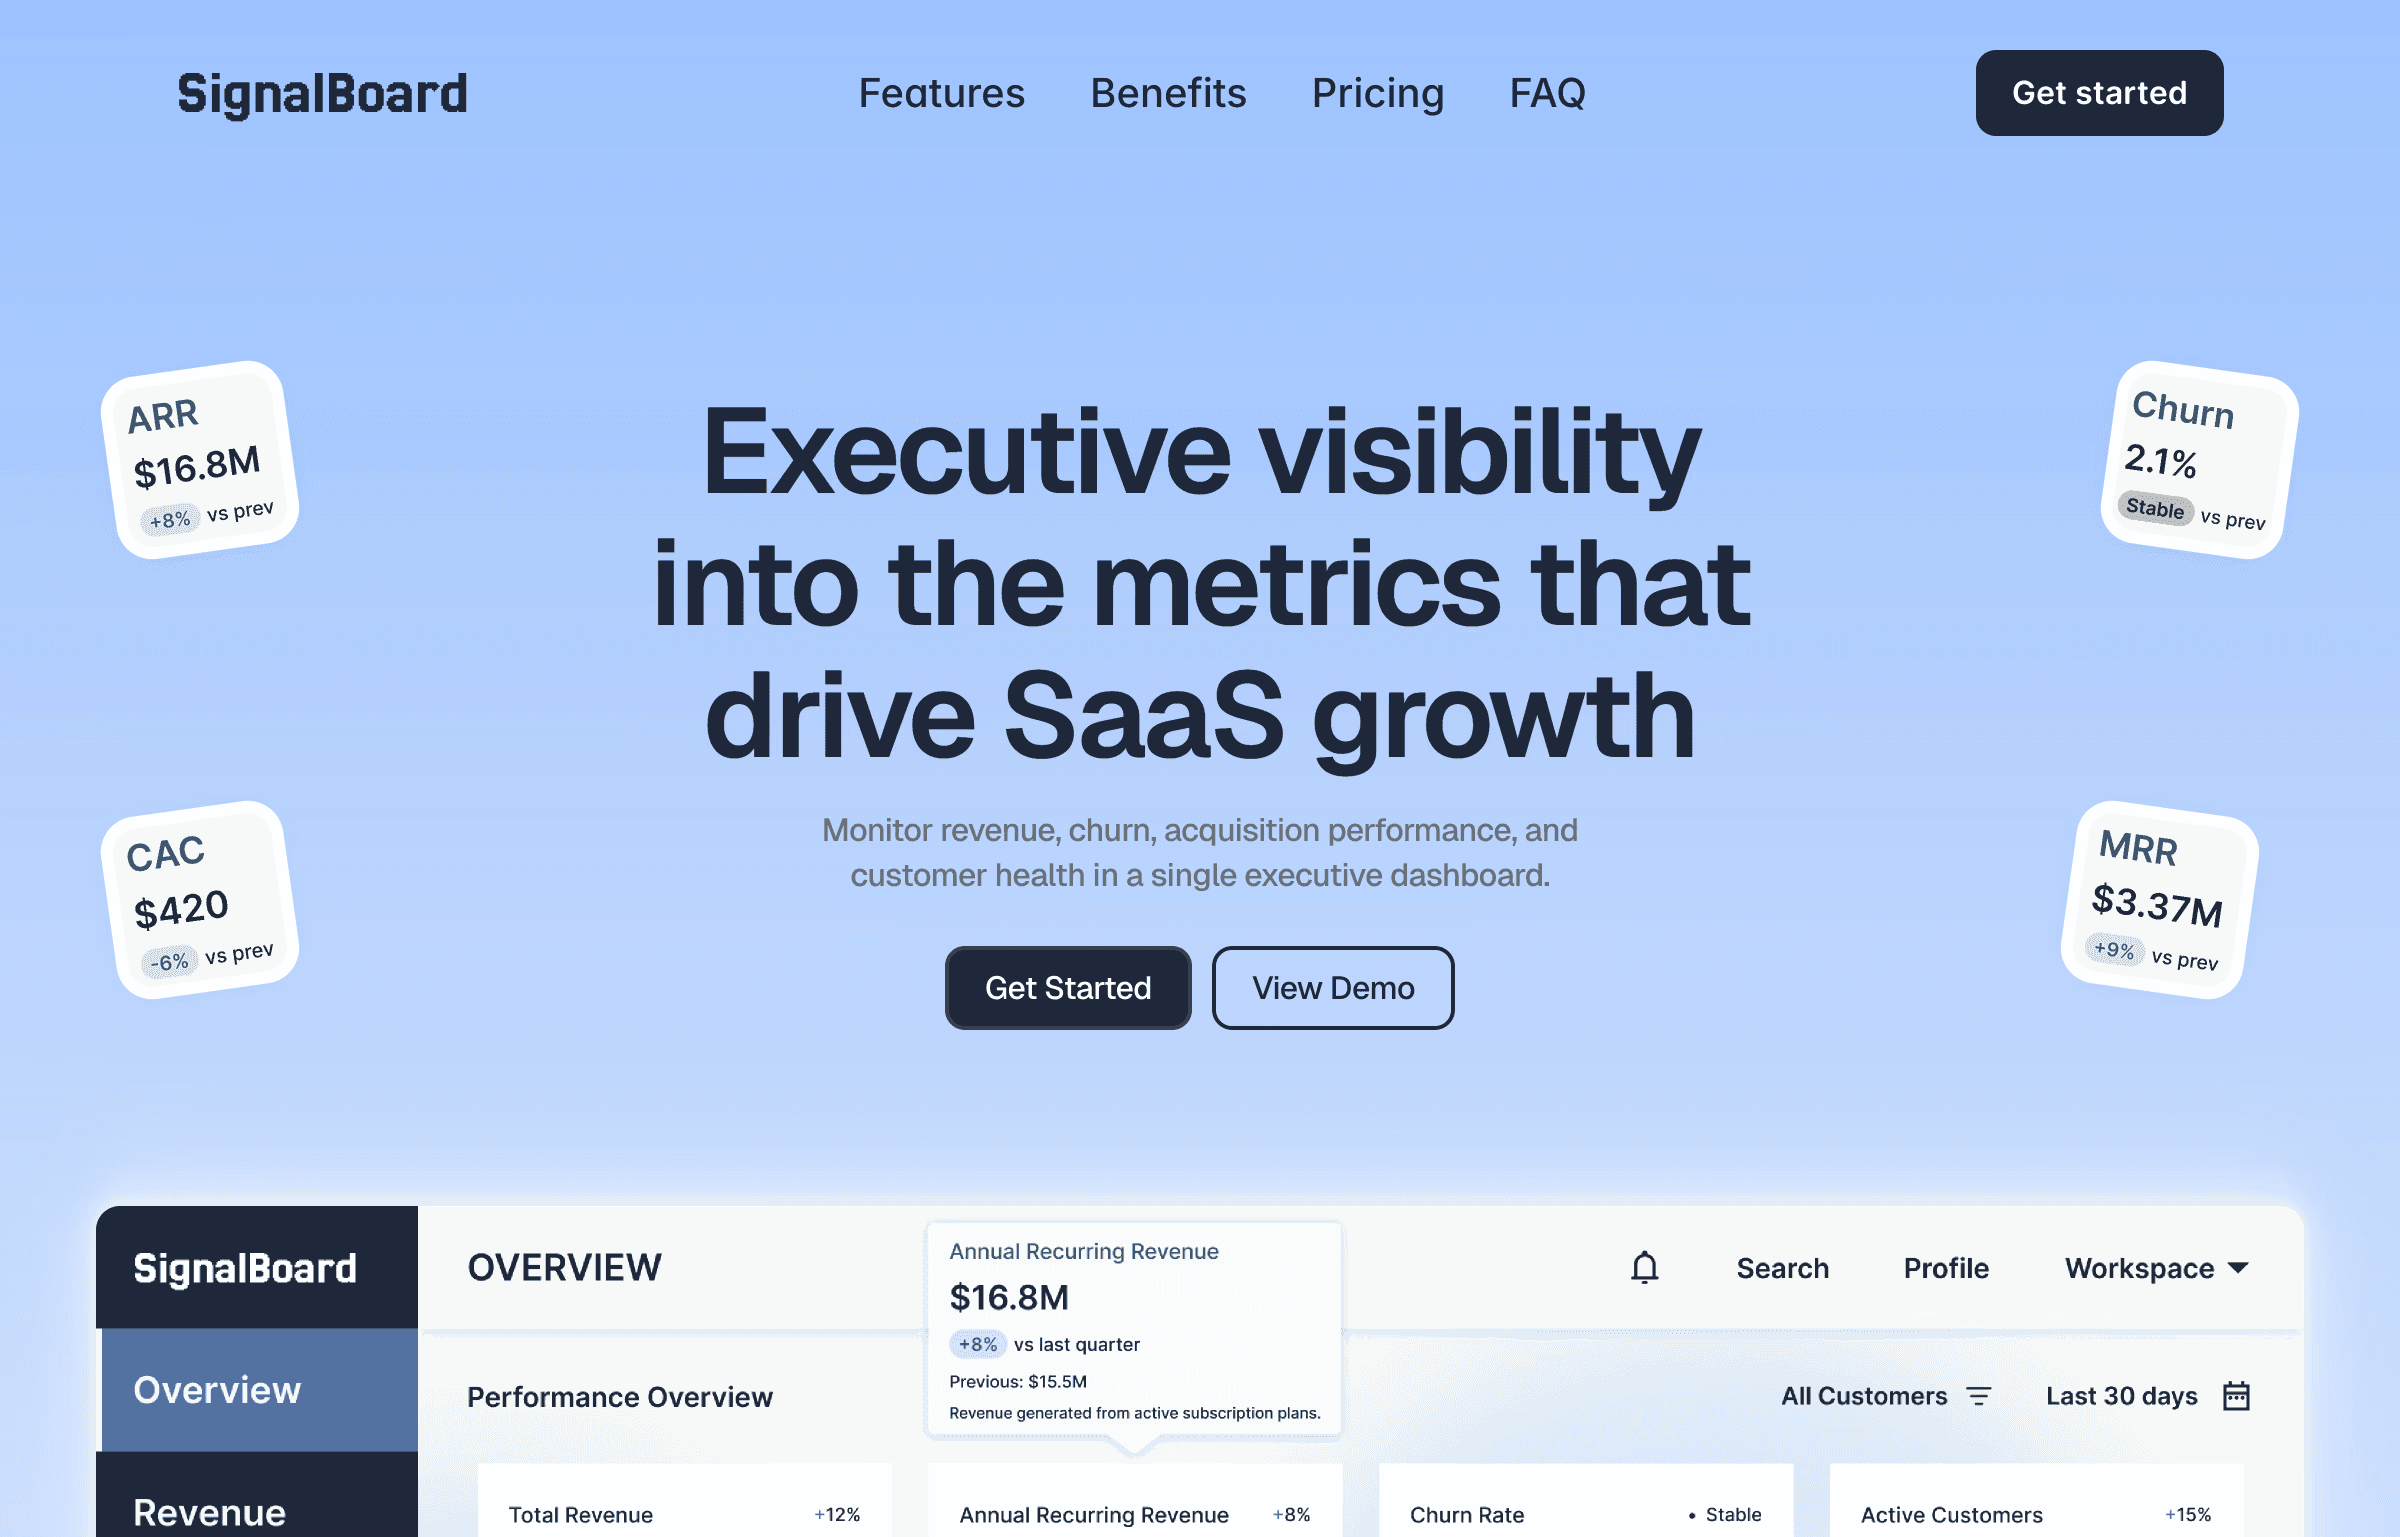
The project includes a full marketing landing page, showing how the product communicates its value to prospective customers.
The project includes a full marketing landing page, showing how the product communicates its value to prospective customers.
The project includes a full marketing landing page, showing how the product communicates its value to prospective customers.
View Landing Page
View Landing Page
Impact
Impact
Faster Decisions
Faster Decisions
Leadership gets the full picture in one view instead of waiting for someone to compile a report.
Leadership gets the full picture in one view instead of waiting for someone to compile a report.
Less Context Switching
Less Context Switching
Revenue, retention, and acquisition data in one place means fewer tabs, fewer exports, fewer handoffs.
Revenue, retention, and acquisition data in one place means fewer tabs, fewer exports, fewer handoffs.
Earlier Risk Visibility
Earlier Risk Visibility
Churn and revenue exposure sit on the same screen, so at-risk accounts surface before they become lost accounts.
Churn and revenue exposure sit on the same screen, so at-risk accounts surface before they become lost accounts.

